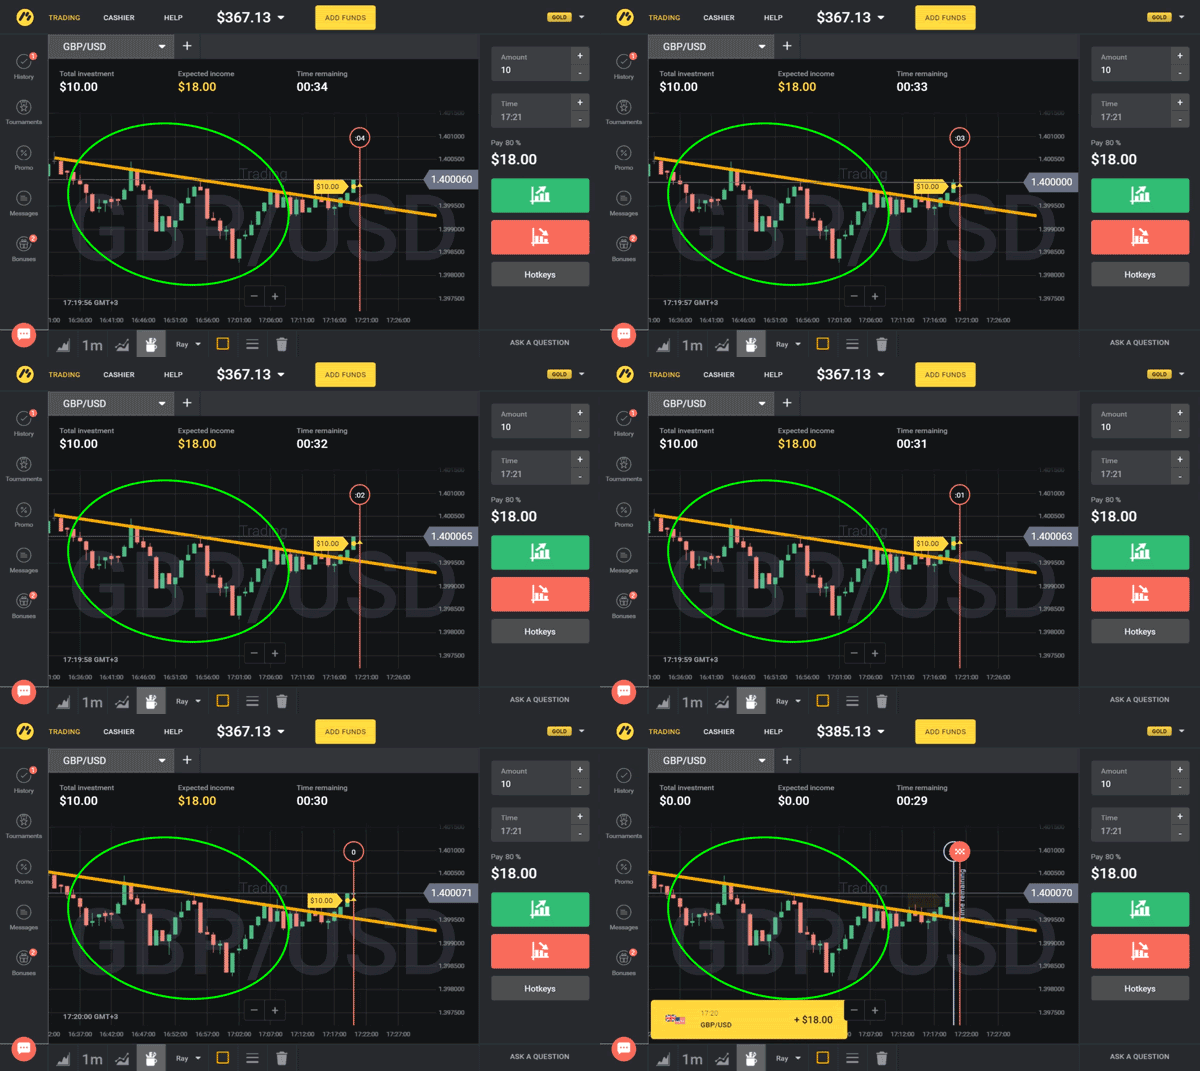
"Triple Bottom" is a well-known reversal figure. We circled it in green in the picture below: the candlesticks "bounce" off the support level three times, and then they break through the resistance level. If you see the "Triple Bottom," there is a high probability that a trade UP will bring you profit. The main thing is not to miss the moment!
How to find the "Triple Bottom"?
1. There is a downtrend on the chart for a long time. 2. Three peaks and minimums are formed and they are on the same level. 3. The price reaches the resistance line for the fourth time and breaks through it upwards.
The great secret is the simplest one.
In today’s article we’ll teach you to prognose graph movements by simply looking at it. Do not struggle with indicators telling you different things, installing programs, robots or signals.
Candles create different shapes which predict a certain market movement. We’ll look through three basic patterns in that article.
Dragonfly and Gravestone Doji
What: identifies day’s highest or lowest points. It shows some kind of limit higher or lower of which the price should not move. Those are market turning points.
How to find: T-shaped candles with same open and close price which are located at the highest or lowest level of the candle
pict1
The falling three
What: indicates the continuation of the bearish movement.
How to find: It is formed by 5 candles. Two outer candles are bearish. Three inner candles can be bullish. The main point is those three candles do not exceed the first red candle open price. Inner candles move inside the range of the red candle without breaking out.
The rising three
Similar to the falling three pattern but indicates bullish market.
What: indicates the continuation of the bullish movement.
How to find: The pattern starts with the long green candle. Following are three red candles which are located inside the range set by the first green candle. Another long green candle closes that pattern. If you see that combination - bullish trend is continuing.
pict 2
Engulfing and Engufling
A reversal pattern
What: indicates that the market is about to turn in another direction.
How to find: look for the candle to be “overshadowed” by the following one. The first candle of one color will be smaller that the second candle of another color. The bigger candle indicates the trend.
pict3
Keep on learning and developing your trading skills with your favourite broker! Train on Demo platform while we are preparing new useful tricks and strategies for the next week! Once you have mastered these patterns, switch to Real platform!
Fractal trading is only one of the evaluation methods which is effective during the periods of a stable trend, while in a wide flat can be unprofitable. It is necessary to understand that the fractals trade strategies were initially developed for the stock market which was less volatile and more predicted.
2. What is the fractal analysis and what’s its value?
3. Conditions of the fractal’s use in Forex trading
4. Strategy Alligator + Fractal
5. Williams fractals without additional indicators
6. Result
Trading with fractals is extensively used by the large market players and it is the best indicator of the fractals’ reliability. The combinations of fractals have such characteristics as self-similarity, scaling and memory of the «entry conditions», and, therefore, they can be used successfully for making price forecasts.
The French economist and the mathematician, the creator of fractal geometry Benoit Mandelbrot was the first person who had paid attention to the repeating price formations. The analysis of the prices for cotton for the period of more than 100 years had led to the creation of the effective trade technique for the first time mentioned in the well-known «Trading chaos» by Bill Williams. It was Williams who for the first time suggested that the market was chaotic, multiple-factor and self-regulating system and cancelled all linear models.
HOW TO USE FRACTALS IN FOREX
Fractal links of exchange prices and the repeating structures have been confirmed by the results of computer modeling.
The fractal (fr om Latin fractus) means a steady scalable design of irregular shape emerging on any data. The trade fractal in the financial market is the candle pattern formed by at least 5 (or more) candles, max/min of the central candle of which exceeds the extremes of the neighboring candles.
Emergence of fractals means the beginning of a new price pyramid and is considered as a trading signal.
Pict1
A fractal up (or a signal to enter to buy) is the set in which (at least) 5 consecutive bars form a pattern, wh ere the highest maximum is shown by an average candle.
A fractal down (or a signal for position to sell) is the reverse pattern made up by five (or more) consecutive candles, the average from which shows the lowest minimum.
WHAT IS THE FRACTAL ANALYSIS AND WHAT’S ITS VALUE?
The aim of such analysis is «to notice» in time and correctly to treat fractal designs in conjunction with other market data regardless of whether they are fundamental and technical, volume and temporary. The set of the real fractals is very dynamic. It can vary depending on quantity and structure. For instance, emergence of max/min for a fractal need not be consecutive. The main thing is that one of the central bars has to show an obvious extreme. Therefore, non-standard combinations can also be used as fractals:
Pict2
If the extremes have appeared at several bars of a pattern, then only the last will be taken into account as a trading signal. Current price movement 1 point higher the level of the fractal up is the breakthrough of the sellers, while if it is 1 point below the fractal down, it is a breakthrough of the buyers. The approximate scheme of an entry is shown below.
The fractal’s emergence means the strong turning impulse confirmed by preliminary movement at formation of the pattern. The strongest signal is just after its emergence, and the same group of candles can be used both for upper and for the lower fractals. Pointers of the appeared fractals are not redrawn.
The border of the upper fractal is the maximum, while the border of the lower is the minimum. In this case of fractal’s trading there shall be an entry in a direction opposite to the created fractal, stop is 1-5 points higher/lower than the border of key bar. In case of formation of an opposite fractal, the current trading signal is cancelled.
CONDITIONS OF THE FRACTAL’S USE IN FOREX TRADING
The emergence of two multidirectional fractals close to each other (sometimes in one candle) is called a fractal start: further the market is assumed to make the decision for the benefit of one of the directions.
When carrying out the fractal analysis we pay attention to the standard factors:
a) The longer the period of formation of fractal structure, the more reliable the trading signal given by it.
b) The less timeframe, the more ‘false’ fractals and breakdowns will appear. Sometimes the expectation of the moment when the ‘correct’ fractal is created, leads to the omission of the good point of entry.
c) In case of the emergence of several multidirectional fractals at some level with the subsequent breakdown of the level it is possible to expect a strong and long trend in the direction of breakdown.
d) The fractal represents the beginning (or the end) of some pulse movement and, therefore, it can quite be considered as a wave structure. It is possible to apply fractals in the wave analysis only on the periods from the D and above. In case of the determination of ‘validity’ of breakthrough of a fractal it is important to carry out correctly the analysis of the candle structure on which this fractal was formed.
e) If closing of a breakthrough candle happens far beyond the accumulation level, then it is possible to open in the direction of breakthrough on a smaller timeframe.
f) If the candle design represents the pivoting model, then with a high probability it is possible to expect the emergence of the return fractal and transition in flat.
The true breakdown of a fractal on any timeframe shall be confirmed by certain volumes. A firm breakthrough candle but with the small volume appears to be an unstable signal. Also for an assessment of volumes it is recommended to use standard designs of Price Action.
Nowadays nobody looks for the trading fractals on a price chart manually. For these purposes a standard package of any trade platform includes the Fractals indicator. We will offer two popular trading strategies on its basis.
STRATEGY ALLIGATOR + FRACTAL
Regular Fractals and Alligator indicators with standard settings are necessary for using this strategy. We trade all major currency and future assets: for the analysis and an entrance - M15, for maintenance – from H1 above (for futures - from D1 above).
Pict3
The entry scheme for fractals Forex trading is shown below. Stop losses are on an opposite extreme from 2 last fractals: purchase is below the lowest, sale is slightly higher than the highest. We hold the transaction until the return fractal has been formed. In a flat we ignore all fractals.
Pict4
While making the fractal market analysis using this technique, it is necessary to remember that:
i. it is impossible to trade against the direction of the Alligator;
ii. the first fractal after the Alligator exit from hibernation is the warning signal;
iii. in case of a long narrow flat it is possible to put the pending orders beyond the borders of small fractals;
iv. the red Alligator’s line is the line of dynamic stop;
v. in case of stop closure the following entrance will be only after emergence of the next fractal.
WILLIAMS FRACTALS TRADING STRATEGY WITHOUT ADDITIONAL INDICATORS
Any currency asset of a middle volatility subject to steady trends is traded: EUR/USD, AUDUSD, GBP/USD. The period for the analysis and entry is D1. Stops and profits are usually not put, at the end they are closed manually.
If there is a fractal up it is a sale, in case of the lower fractal there is a purchase. It is possible to enter by a market order, and also by the pending orders:
a. purchase - BuyStop is 2-5 points higher than a max of the second candle following a key candle of a fractal;
b. sale - SellStop is 2-5 points lower than a min of the second candle following the key candle.
Pict5
Shortcoming: the considerable part of the main movement passes by in the expectation of the ‘correct’ fractal.
RESULT
Fractal trading is only one of the evaluation methods of the market which is effective during the periods of a stable trend, while in a wide flat can be unprofitable. It is necessary to understand that the fractals trade strategies were initially developed for the stock market which was less volatile and more predicted. Unusual market situations arising in Forex often cause failure in calculation of fractals construction, and also emergence of ‘false’ or difficult for recognition signals. However, fractals in conjunction with the trend instruments represent the powerful tool of a technical analysis and can be the basis of constructing the steadily profitable system.
Perdagangan fraktal hanyalah salah satu metode evaluasi yang efektif selama periode tren stabil, sementara di flat yang luas bisa jadi tidak menguntungkan. Perlu dipahami bahwa strategi perdagangan fraktal pada awalnya dikembangkan untuk pasar saham yang kurang stabil dan diperkirakan.
3.Kondisi penggunaan fraktal dalam perdagangan Forex
4.Strategy Alligator + Fraktal
5.Williams fractals tanpa indikator tambahan
6.Result
Perdagangan dengan fraktal banyak digunakan oleh pelaku pasar yang besar dan ini merupakan indikator keandalan fractals yang terbaik. Kombinasi fraktal memiliki karakteristik seperti kesamaan diri, penskalaan dan memori dari «kondisi masuk», dan oleh karena itu, mereka dapat digunakan dengan sukses untuk membuat ramalan harga.
Ekonom Prancis dan matematikawan, pencipta geometri fraktal Benoit Mandelbrot adalah orang pertama yang memperhatikan formasi harga yang berulang. Analisis harga kapas untuk periode lebih dari 100 tahun telah menghasilkan teknik perdagangan yang efektif untuk pertama kalinya yang disebutkan dalam kekacauan perdagangan Trading oleh Bill Williams. Williamslah yang untuk pertama kalinya mengemukakan bahwa pasar kacau, sistem multiple-factor dan self-regulating dan membatalkan semua model linier.
CARA MENGGUNAKAN FRAKTAL DI FOREX
Tautan fraktal dari harga tukar dan struktur berulang telah dikonfirmasi oleh hasil pemodelan komputer.
Fraktal (fr om Latin fractus) berarti desain skalar stabil bentuk tak beraturan yang muncul pada data apapun. Fraktal perdagangan di pasar keuangan adalah pola lilin yang dibentuk oleh setidaknya 5 (atau lebih) lilin, maks / min lilin sentral yang melebihi ekstrem dari lilin tetangga.
Munculnya fraktal berarti awal dari sebuah piramida harga baru dan dianggap sebagai sinyal perdagangan.
Pict1
Fraktal (atau sinyal untuk masuk untuk membeli) adalah himpunan di mana (setidaknya) 5 bar berturut-turut membentuk sebuah pola, dimana maksimum tertinggi ditunjukkan oleh rata-rata lilin.
Sebuah fraktal turun (atau sinyal untuk posisi untuk menjual) adalah pola terbalik yang dibuat oleh lima (atau lebih) lilin berturut-turut, rata-rata dari mana menunjukkan minimum terendah.
APA ANALISIS FRAKAL DAN NAMANYA?
Tujuan dari analisis tersebut adalah «memperhatikan» pada waktunya dan benar untuk memperlakukan desain fraktal bersamaan dengan data pasar lainnya terlepas dari apakah itu fundamental dan teknis, volume dan sementara. Kumpulan fraktal yang sebenarnya sangat dinamis. Hal ini dapat bervariasi tergantung pada kuantitas dan struktur. Misalnya, kemunculan max / min untuk fraktal tidak perlu berurutan. Hal utama adalah bahwa salah satu bar pusat harus menunjukkan ekstrem yang jelas. Oleh karena itu, kombinasi non-standar juga dapat digunakan sebagai fraktal:
Pict2
Jika ekstrem telah muncul di beberapa batang pola, maka hanya yang terakhir yang akan diperhitungkan sebagai sinyal perdagangan. Pergerakan harga saat ini 1 poin lebih tinggi tingkat fraktal adalah terobosan para penjual, sedangkan jika 1 poin di bawah fraktal turun, itu adalah terobosan pembeli. Skema perkiraan dari sebuah entri ditunjukkan di bawah ini.
Kemunculan fraktal berarti impuls balik kuat yang dikonfirmasi oleh gerakan awal pada pembentukan pola. Sinyal terkuat hanya setelah kemunculannya, dan kelompok lilin yang sama dapat digunakan baik untuk bagian atas maupun untuk fraktal bawah. Pointer fraktal yang muncul tidak digambar ulang.
Batas fraktal atas adalah maksimum, sedangkan batas bawahnya adalah minimum. Dalam kasus perdagangan fraktal ini, akan ada entri yang berlawanan dengan fraktal yang dibuat, berhenti 1-5 poin lebih tinggi / lebih rendah dari batas bar utama. Jika terjadi fraksi berlawanan, sinyal perdagangan saat ini dibatalkan.
KONDISI PENGGUNAAN FRAKAL DALAM PERDAGANGAN FOREX
Munculnya dua fraktal multidirectional yang dekat satu sama lain (kadang dalam satu lilin) disebut fraktal: semakin jauh pasar diasumsikan membuat keputusan untuk keuntungan salah satu arah.
Saat melakukan analisis fraktal, kami memperhatikan faktor standar:
a) Semakin lama periode pembentukan struktur fraktal, semakin diandalkan sinyal perdagangan yang diberikan olehnya.
b) Kerangka waktu yang kurang, fractals dan breakdown yang lebih 'salah' akan muncul. Terkadang harapan saat fraktal 'benar' tercipta, menyebabkan kelalaian titik masuk yang baik.
c) Dalam kasus munculnya beberapa fraksi multidirectional pada tingkat tertentu dengan rincian tingkat berikutnya, kemungkinan untuk mengharapkan tren yang kuat dan panjang ke arah rincian.
d) Fraktal mewakili awal (atau akhir) dari beberapa gerakan nadi dan, oleh karena itu, ini dapat dianggap sebagai struktur gelombang. Hal ini dimungkinkan untuk menerapkan fraktal dalam analisis gelombang hanya pada periode dari D dan di atas. Dalam kasus penentuan 'validitas' terobosan fraktal, penting untuk dilakukan dengan benar analisis struktur lilin tempat fraktal terbentuk.
e) Jika penutupan lilin terobosan terjadi jauh melampaui tingkat akumulasi, maka dimungkinkan untuk membuka arah terobosan pada kerangka waktu yang lebih kecil.
f) Jika desain lilin mewakili model pivoting, maka dengan probabilitas tinggi dimungkinkan untuk mengharapkan kemunculan fraktal kembali dan transisi di flat.
Urutan fraktal yang benar pada kerangka waktu harus dikonfirmasi dengan volume tertentu. Lilin terobosan yang tegas namun dengan volume kecil nampaknya menjadi sinyal yang tidak stabil. Juga untuk penilaian volume, disarankan untuk menggunakan desain standar Price Action.
Saat ini tidak ada yang melihat fraktal perdagangan pada grafik harga secara manual. Untuk tujuan ini, paket standar dari setiap platform perdagangan mencakup indikator Fractals. Kami akan menawarkan dua strategi perdagangan yang populer atas dasar usahanya.
STRATEGI ALLIGATOR + FRACTAL
Indikator Fractals and Alligator Reguler dengan pengaturan standar diperlukan untuk menggunakan strategi ini. Kami memperdagangkan semua aset utama mata uang dan masa depan: untuk analisis dan masuk - M15, untuk perawatan - dari H1 di atas (untuk futures - dari D1 di atas).
Pict3
Skema masuk untuk perdagangan Forex fraktal ditunjukkan di bawah ini. Menghentikan kerugian berada pada ekstrem yang berlawanan dari 2 fraktal terakhir: pembelian berada di bawah harga terendah, penjualan sedikit lebih tinggi daripada yang tertinggi. Kami memegang transaksi sampai fraktal kembali terbentuk. Di flat kita abaikan semua fraktal.
Pict4
Sementara membuat analisis pasar fraktal dengan menggunakan teknik ini, perlu diingat bahwa:
1. Itu tidak mungkin untuk diperdagangkan melawan arah Alligator;
2. ii. Frase pertama setelah Alligator keluar dari hibernasi adalah sinyal peringatan;
3. Dalam kasus flat yang panjang dan sempit, dimungkinkan untuk menempatkan pesanan yang tertunda di luar batas fraktal kecil;
4. Garis merah Alligator adalah garis penghenti dinamis;
5. V. dalam kasus stop closure pintu masuk berikut akan menjadi hanya setelah munculnya fraktal berikutnya.
STRATEGI PERDAGANGAN FRAKTAL WILLIAMS tanpa INDIKATOR TAMBAHAN
Setiap aset mata uang volatilitas tengah tunduk pada tren stabil diperdagangkan: EUR / USD, AUDUSD, GBP / USD. Periode untuk analisis dan entri adalah D1. Berhenti dan keuntungan biasanya tidak ditaruh, pada akhirnya ditutup secara manual.
Jika ada fraktal itu adalah penjualan, dalam kasus fraktal yang lebih rendah ada pembelian. Dimungkinkan untuk masuk dalam urutan pasar, dan juga dengan perintah yang tertunda:
a.Purchase-BuyStopadalah 25 poin lebih tinggi dari maksimal lilin kedua setelah sebuah lilin kunci fraktal;
b.sale - SellStop adalah 2-5 poin lebih rendah dari satu menit dari lilin kedua setelah lilin kunci.
Pict5
Kelemahan: sebagian besar pergerakan utama lewat dengan harapan fraktal 'benar'.
HASIL
Perdagangan fraktal hanyalah salah satu metode evaluasi pasar yang efektif selama periode tren stabil, sementara di flat yang datar bisa saja tidak menguntungkan. Perlu dipahami bahwa strategi perdagangan fraktal pada awalnya dikembangkan untuk pasar saham yang kurang stabil dan diperkirakan. Situasi pasar yang tidak biasa yang terjadi di Forex sering menyebabkan kegagalan dalam perhitungan konstruksi fraktal, dan juga munculnya sinyal 'salah' atau sulit dikenali. Namun, fraktal bersamaan dengan instrumen tren merupakan alat analisis teknis yang hebat dan dapat menjadi dasar untuk membangun sistem yang menguntungkan.